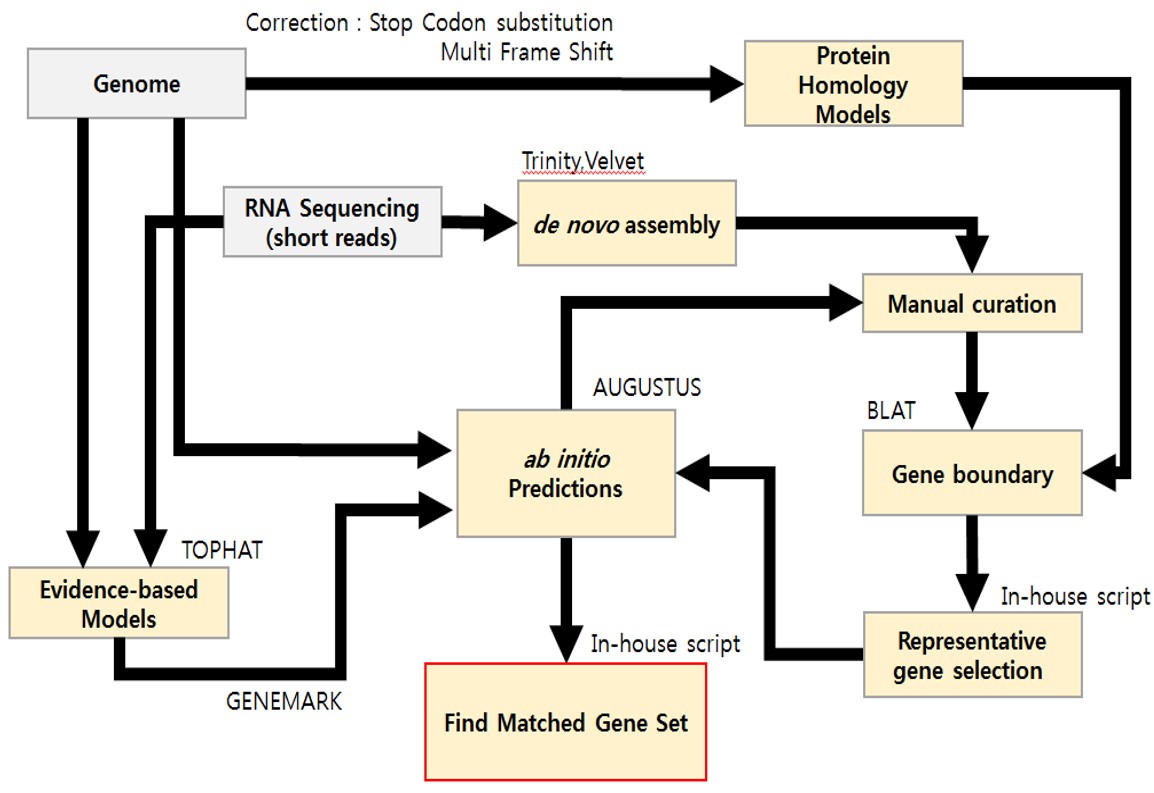
Gene prediction for N. salina CCMP1776 (version 2)
|
Overview
Transcriptomic data for N. salina CCMP 1776 that had not been previously published, were based on three independent repeats of RNA-seq for normal and nitrogen (N) limitation.N. salina WT was cultivated under normal and N limitation condition to isolate RNA as described in [1, 2]. F2N medium was used for normal condition. F2N media with 75 mg/L NaNO3 50 g/L sea salt were used for N limitation and osmotic stress condition, respectively. The culture conditions were followings: 25°C, 120 rpm, under 120 µmol photons/m2/s of fluorescent light, and 0.5 vvm air containing 2% CO2. The samples were obtained at 4, 8, and 12 day to extract RNA. After cell harvest at the mid-exponential phase, 200 mg of wet biomass was used to obtain total RNA.Reference 1. Kang, N.K., et al., Effects of overexpression of a bHLH transcription factor on biomass and lipid production in Nannochloropsis salina. Biotechnol Biofuels, 2015. 8: p. 200. 2. Kwon, S., et al., Enhancement of biomass and lipid productivity by overexpression of a bZIP transcription factor in Nannochloropsis salina. Biotechnol Bioeng, 2018. 115(2): p. 331-340. The statistics of RNA-seq data used to assist gene model prediction are listed below:
More details, please contact Prof. Byeong-ryool Jeong (bjeong@unist.ac.kr). Properties
|
|||||||||||||||||||||||||||||||||||||||||||||||||||||||||||||||||||||||||||||||||||||||||||||||||
